

AWS Fargate is a technology that allows you to run containers without the need to manage the underlying clusters or servers. However, AWS Fargate does have certain limitations due to its abstraction layer. This is the reason why directly integrating Datadog agents with AWS Fargate can be challenging, as Datadog agents require elevated privileges that Fargate's environment doesn't inherently support.
So the question is how do we deploy it in the Farget cluster?
I have spent a good amount of time reading documentations and dealing with the Datadog Support team. In this article, I’ll show you how to make that possible and bonus points for what is missing in documentation.
So let’s get started…
When it comes to Datadog, we have 2 things to deploy.
1. Datadog Agent,
2. Cluster Agent.
To deploy Datadog Agent:
We need to implement the concept of a sidecar, which entails creating two containers within a single pod. This setup allows the two containers to share the same networking and storage resources while serving distinct purposes. For instance, one container could be a Nginx instance, and the other container could be a Datadog agent.
- At first, we need to create a kubernetes role and service account in EKS using the below script.
Kubectl apply -f rbac.yaml - For creating the deployment use below script using command kubectl apply -f nginx-dd.yaml. I have used Nginx deployment for this blog but you can use your own application and add Datadog as a sidecar container.
apiVersion: rbac.authorization.k8s.io/v1
kind: ClusterRole
metadata:
 name: datadog-agent
rules:
 - apiGroups:
   - ""
   resources:
   - nodes
   - namespaces
   - endpoints
   verbs:
   - get
   - list
 - apiGroups:
    - ""
   resources:
    - nodes/metrics
    - nodes/spec
    - nodes/stats
    - nodes/proxy
    - nodes/pods
    - nodes/healthz
   verbs:
    - get
---
apiVersion: rbac.authorization.k8s.io/v1
kind: ClusterRoleBinding
metadata:
  name: datadog-agent
roleRef:
  apiGroup: rbac.authorization.k8s.io
  kind: ClusterRole
  name: datadog-agent
subjects:
 - kind: ServiceAccount
   name: datadog-agent
   namespace: default
---
apiVersion: v1
kind: ServiceAccount
metadata:
  name: datadog-agent
  namespace: default
apiVersion: apps/v1
kind: Deployment
metadata:
  name: nginx-deployment
spec:
 selector:
  matchLabels:
   app: nginx
 replicas: 1 # tells deployment to run 2 pods matching the template
 template:
  metadata:
   labels:
    app: nginx
  spec:
   serviceAccountName: datadog-agent
   containers:
    - name: nginx
      image: nginx:1.14.2
      ports:
       - containerPort: 80
    - image: datadog/agent
      name: datadog-agent
      env:
       - name: DD_API_KEY
         value: <Your API Key>
       - name: DD_SITE
         value: "us5.datadoghq.com"
       - name: DD_EKS_FARGATE
         value: "true"
       - name: DD_CLUSTER_NAME
         value: "datadog-test-cluster"
       - name: DD_KUBERNETES_KUBELET_NODENAME
         valueFrom:
          fieldRef:
           apiVersion: v1
            fieldPath: spec.nodeName
By applying this configuration, you should be able to get both your containers Nginx and Datadog sidecar running. Check the logs for any errors. Chances that you might miss configure Datadog API Key or Site URL .
You should be able to see your Container inside the Datadog portal after applying this. Go to Infrastructure -> Containers in Datadog portal.
Note:
- Site URL:
- - Datadog provides different sites across the world. Data cannot be shared between the sites. Sites are mentioned in the link below.
Datadog Site Reference - - us5.datadoghq.com is the site URL that datadog redirected when I created it’s free account. In your case, the site URL might be different than mine.
- Create DataDog api key using below link:
- - Datadog API Keys
- - Remember API Key and App keys are different in Datadog.
- - Without an API key and a datadog site URL, the datadog agent might not be able to locate your DataDog account.
Datadog Cluster Agent:
Now We will install Cluster Agent:
- - Add helm repository using this command helm repo add datadog
- - Run this command for update your repo for helm helm repo update
- - Create values.yaml for datadog like below
- NOTE: For token create a random token online using this link sample-token-generator.
- - Deploy helm chart using below command:
- - helm install datadog datadog/datadog -f values.yaml
- - Add below parameters in sidecar container.
datadog:
 apiKey: <Your API Key>     #APi key
 clusterName: <Cluster_Name>
 site: us5.datadoghq.com    #site URL
agents:
 enabled: false
clusterAgent:
 enabled: true
 replicas: 2
 token: <Your token>     #change here
env:
 - name: DD_CLUSTER_AGENT_ENABLED
   value: "true"
 - name: DD_CLUSTER_AGENT_AUTH_TOKEN
   value: <hardcoded token value>
 - name: DD_CLUSTER_AGENT_URL
   value: https://<CLUSTER_AGENT_SERVICE_NAME>.<CLUSTER_AGENT_SERVICE_NAMESPACE>.svc.cluster.local:5005
 - name: DD_ORCHESTRATOR_EXPLORER_ENABLED
   value: "true"
 - name: DD_CLUSTER_NAME
   value: <CLUSTER_NAME>
Get Logs of your Container / Pods:
Since our Datadog agent can’t send logs, we need to set up a Datadog Forwarder that will get the logs and Share it with Datadog.
- Get logs to CloudWatch through Fluentbit (Don’t forget to enable Advanced Filter that shares Kubernetes Attributes)
- Deploy Datadog Forwarder
- Optionally, create Datadog Pipeline
- Login to the datadog portal And go to the integrations and search for the aws service. (for the first time you have to install it.) Click on “configure” and then you will have to select the datadog api key and you will see the button to create a cloudformation stack. In AWS, create a cloud formation stack.
NOTE: If your AWS account is already login it will directly open the cloudformation and set the template. You just need to click on the create button.
- After deploying cloudformation it will create 2 lambda functions and log groups, one for datadog stack and one for datadog forwarder.
- - Create a subscription filter with lambda function (DataDog forwarder) for your EKS loggroup.
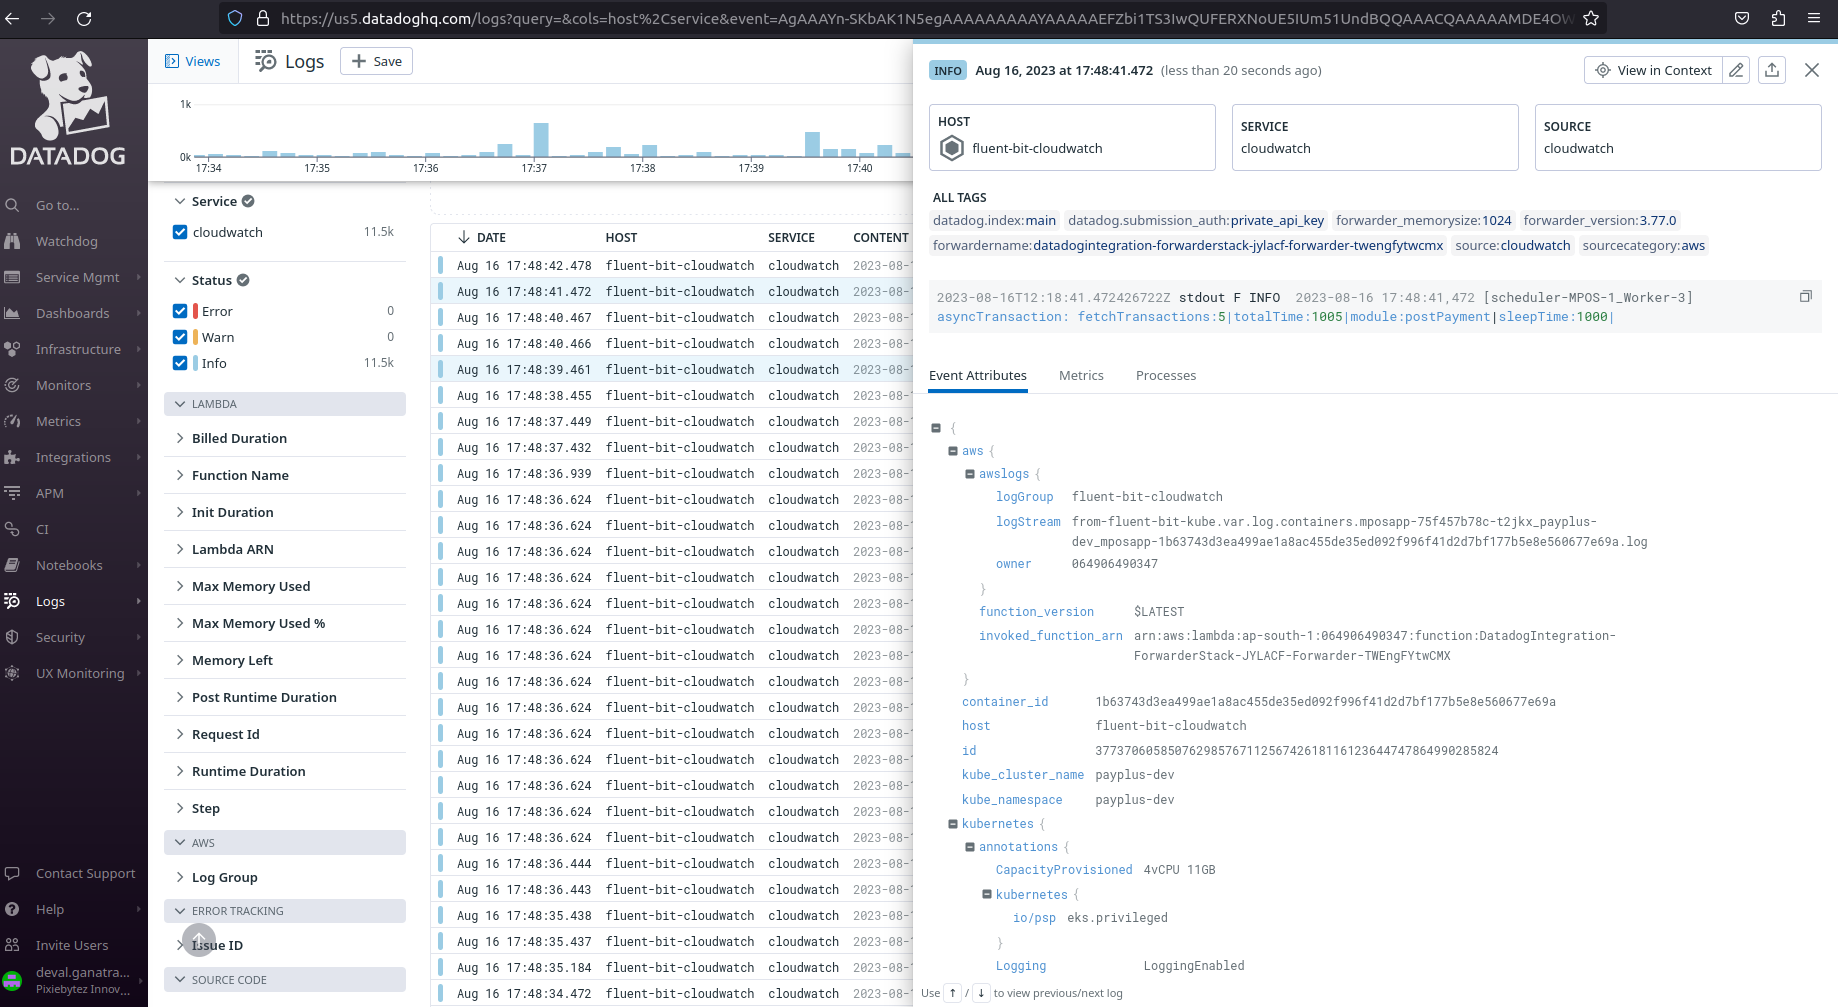
- - After that you will be able to check logs for your datadog console in the logs console.
- But still there is one problem that you won’t get logs by pod and in target you have to create a configmap to filter logs by Kubernetes Attributes like pod,namespace, etc.
apiVersion: v1
kind: ConfigMap
metadata:
 name: aws-logging
 namespace: aws-observability
data:
 filters.conf: |
  [FILTER]
   Name  kubernetes
   Match   kube.*
   Merge_Log  On
   Buffer_Size  0
   Kube_Meta_Cache_TTL  300s
 output.conf: |
  [OUTPUT]
   Name  cloudwatch_logs
   Match   *
   region  ap-south-1
   log_group_name  fluent-bit-cloudwatch
   log_stream_prefix  from-fluent-bit-
auto_create_group true - After applying this configmap you will be able to get the logs by pod name but still we need to check logs by particular pod name so, for that we need to run a query which is below:
- - @kubernetes.namespace_name:amazon-cloudwatch : Filters all the logs in the given namespace.
- - @kubernetes.pod_name:nginx-deployment* : Filters all the logs in the given Deployment.
- - @aws.awslogs.logStream:*nginx* : Filters all the logs with a given pattern.
Brief high level steps are:
Till now you’re good to go ahead with. But as a bonus, I’ll share one more tip about Datadog Pipelines. It’s an awesome feature that lets you modify the logs received in the Datadog console.
Time for Bonus tip
So our goal is to map the key `kubernetes.pod_id` to the key that Datadog recognizes (i.e. pod_id ). Here is how you can do:
- - For checking the logs of DataDog Go to the pipeline page link is below.Datadog Pipelines
- - Create a new processor and select “string builder processor”
- - Put a name and put a query of your requirement like below:
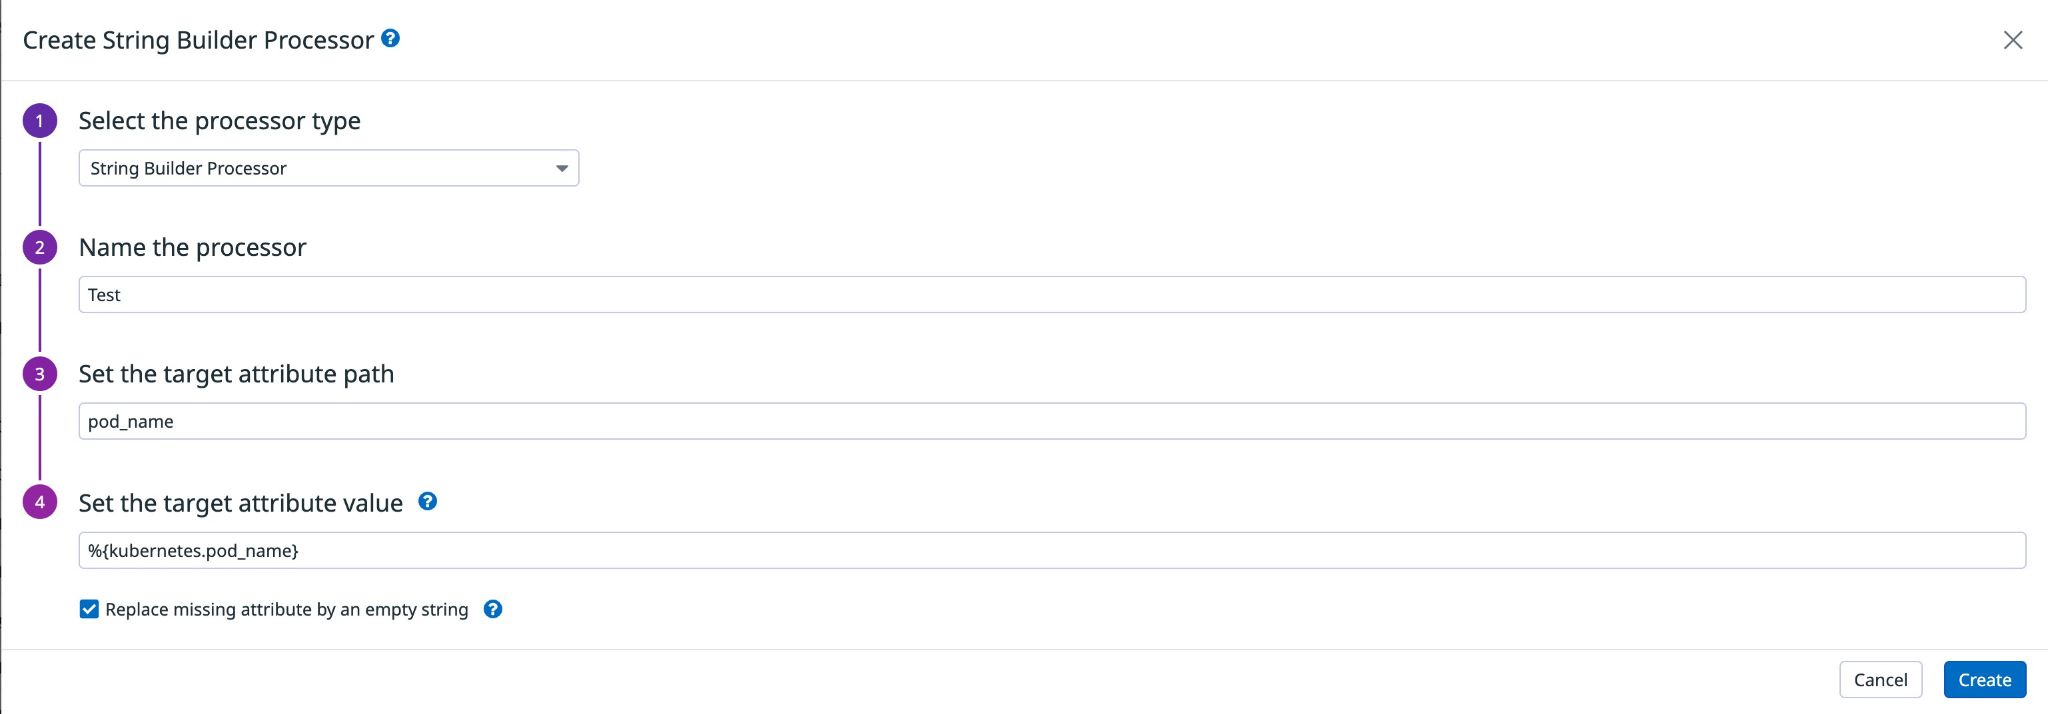
This way your Fluentbit logs will have required keys copied outside and it will be easier for you to filter based on POD_NAME or Namespace etc.
Hope you enjoyed it.